Hemoglobin and Myoglobin
⇰ Science Topic information page
♦ For terminology and basic concepts, refer to the pages about
Principles of diffusion and
Facilitation Pressure.
When a diffusion layer is not inert, fluxes into or out of a chamber will no longer
be linearly related to the partial
pressure difference across the layer. In case of hemoglobin (Hb) or myoglobin (Mb),
there is facilitated diffusion and the total oxygen (O2) flux J can be described by:
where ℘ is permeability, L layer thickness, ΔP and ΔS partial
pressure and saturation difference across the layer, and the constant
PF is facilitation pressure.
Again, there can be layer bulging, of the layer supporting the Hb or Mb solution;
the oxygen pressure change in an adjacent closed chamber
is (1):
| dP |
= |
ART | |
℘* |
{(1 − c P)ΔP
+ PF(1 − cFP)ΔS} |
| dt |
V | |
L |
 where P is oxygen partial pressure, A exposed surface area of the layer, R gas
constant, T absolute temperature, V volume of the chamber,
℘* oxygen permeability of the entire layer including supporting membrane,
thickness L,
ΔP, ΔS difference in oxygen pressure and saturation across the layer,
and c, cF correction terms.
In case of equilibrium between O2 and Hb or Mb, ΔS can be derived
from the O2 pressures at the layer borders, but the interesting case
of course is nonequilibrium (2).
where P is oxygen partial pressure, A exposed surface area of the layer, R gas
constant, T absolute temperature, V volume of the chamber,
℘* oxygen permeability of the entire layer including supporting membrane,
thickness L,
ΔP, ΔS difference in oxygen pressure and saturation across the layer,
and c, cF correction terms.
In case of equilibrium between O2 and Hb or Mb, ΔS can be derived
from the O2 pressures at the layer borders, but the interesting case
of course is nonequilibrium (2).
Full evaluation is quite difficult, both theoretical and in particular
experimental (3), but less so for the top
chamber if it is flushed with nitrogen and there is no top membrane, so
Ptop = 0:
| dPtop |
= |
ART | |
℘* |
(Pbottom + PFΔS) |
| dt |
Vtop | |
L |
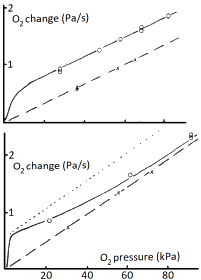
Then, results are relatively simple. With equilibrium, for increasing oxygen bottom
chamber pressure Pbottom, ΔS will approach 1 and the change in
top chamber Ptop will go parallel to a straight line,
with pressure offset PF, as shown in the
top figure. If there is no equilibrium, S at the bottom will still increase up
to 1, but saturation at the top chamber side no longer will be zero; it will
go up with increasing flux, diminishing ΔS. As shown in the bottom figure.
The circles are actual measurements (3).
Note, that top pressure chamber changes are very small to maintain a value
close to zero.
It is possible to calculate reaction rates from such measurements.
(1) Bouwer S Hoofd L Kreuzer F: Diffusion
coefficients of oxygen and hemoglobin measured by facilitated oxygen diffusion
through hemoglobin solutions. BBA 1338(1): 127-136. (1997)
(2) Bouwer S Th Hoofd L Kreuzer F:
Reaction rates of oxygen with hemoglobin measured by non-equilibrium facilitated
oxygen diffusion through hemoglobin solutions. BBA 1525(1-2): 108-117. (2001)
(3) Bouwer S: Facilitated oxygen Diffusion
through hemoglobin solutions. Measurement of diffusion and reaction parameters.
Dissertation thesis, Univ Nijmegen. (1987)
Back to the top of the topic
or Back to before (2)
–