Hemoglobin Saturation
⇰ Science Topic information page
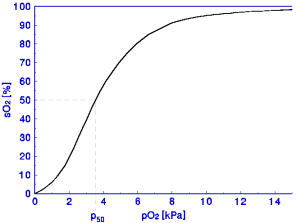 Hemoglobin, Hb, is the red blood cell component responsible for adequate oxygen
(O2) uptake in the lung and release in the body tissues of humans and
many animals. Therefore, it has special binding properties, emerging from its
Saturation curve (ODC), a plot
of the O2 saturation S – the amount bound as a percentage of the
maximum that can be bound – against
oxygen pressure
PO2. The curve shown is the Standard Curve, for normal human blood
under standard conditions pH= 7.4, Temperature= 37°C, normal amount of
2,3DPG.
Hemoglobin, Hb, is the red blood cell component responsible for adequate oxygen
(O2) uptake in the lung and release in the body tissues of humans and
many animals. Therefore, it has special binding properties, emerging from its
Saturation curve (ODC), a plot
of the O2 saturation S – the amount bound as a percentage of the
maximum that can be bound – against
oxygen pressure
PO2. The curve shown is the Standard Curve, for normal human blood
under standard conditions pH= 7.4, Temperature= 37°C, normal amount of
2,3DPG.
The binding properties of Hb are quite special and crucial for adequate O2
supply to tissue. For modelling, a mathematical description of the curve is needed.
The most used one is the Hill equation:
which works remarkably well for the upper part even better than other models.
The n is the Hill constant, 2.7 for humans, and the P50 is that O2
pressure where S=½=50% – this can vary due to conditions.
For the lower part, below ∼15%, the Hill model may severely underestimate S. This
can be overcome by applying a modified Pauling model to the region below S=50%:
| S = |
v3x + 3v4x2 + 3v3x3 + x4
| where x = P/P50 |
|
1 + 4v3x + 6v4x2 + 4v3x3 + x4 |
Both curves fully match in P = P50 for
| n = |
4 + 4v3 |
| 1 + 4v3 + 3v4 |
which for n = 2.7 means v= 0.5; a first approximation for v can be calculated from
v≅3/(2n+1) and then refined by trial and error.
A computer model of Hb saturations and its role in the tissue O2 supply
is SatCur, found on the Applications page.
The Hill model is the widest applied description of the saturation curve but it is
not based on any model. A model-based description is the
MWC model.
A step further is calculation of the rate at which oxygen is released - uptake in
the lung is no problem. Click the topic
‘Kinetics’.
Back to the top of the topic
–